For complex surveys it is sometimes desirable to have different reports for different groups of respondents. Let's say that your survey contains the following question:
3. How long have you been using the product?
| 1) < 6 month |
| 2) 6 - 12 month |
| 3) 1 - 2 years |
| 4) 2 - 5 years |
| 5) > 5 years |
The default reports (Summary report and Comment report) will include all responses. That means that all customers who used the product will be included in the same report regardless how long they have been using it.
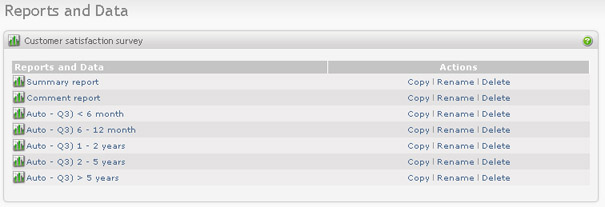
To separate the responses and to get reports for each answer alternative, you can use the "Auto-create reports" feature. The result will then be 6 new reports, one for each item in that selection. All of the auto generated reports will have the same structure, but different report filters.
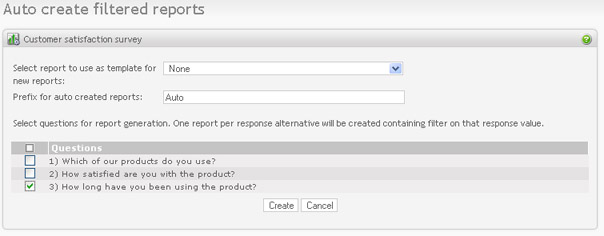
To use this feature, go to "Reports and data" from main survey screen and click on the "Auto create reports" in the Menu box.

To generate reports you need to enter the following data:
-
Report to use as template. Select the report that you want to use for the report generation. The report structure and filters will then be inherited from this report by all the auto generated reports. Select "None" if you want to use the default structure. The generated reports will then contain all questions in the survey with summaries and horizontal bar charts for each question.
-
Prefix. Enter the prefix for all generated report names. This can help to separate the auto created reports from the manually created ones. For example, if you enter value "Auto", the generated reports will be named like this:
Auto - Q3) < 6 month Auto - Q3) 6 - 12 month Auto - Q3) 1 - 2 years Auto - Q3) 2 - 5 years Auto - Q3) > 5 years The prefix value is optional.
-
Questions. Select questions that answer alternatives will be used for report generation. It will be created one report with one filter on each answer alternative for each selected questions.
